

")

 Shareholder/Analyst Call Transcript")

")


Dear Investors,
The Portfolio* appreciated +2.4% (net of fees) year-to-date thru 6/30/25.
Since inception, Marram has generated +598.9% cumulative return and +14.4% annualized return, net of fees.
For monthly details, see Historical Performance Returns* at the end of this letter. Also, please refer to your separate account statement for exact account return figures.
$1,000,000 Investment in Marram (Net Return, Inception 1/1/2011 to 6/30/2025)*
About Marram
Marram is an outsourced long-term investment solution, focused on growing wealth for retirement or legacy purposes. We began as a service for a small circle of friends and family. Our investor-friendly fee structure (lower than hedge funds), terms (separate accounts, no lock-up), and high standards of care and excellence, reflect those origins. Our portfolio manager has the majority of her family’s liquid net worth invested in the same strategy – we eat our own cooking – ensuring that we shepherd your investment with the utmost care, as we would our own.
| OURGOAL: | • To compound (GROW) capital over time |
|---|---|
| PHILOSOPHY: | • Patient Opportunism |
| STRATEGY: | • Buy cheap assets (when available)• Hold cash when there are no cheap assets• Hedge the portfolio when appropriate• Think opportunistically and creatively |
| IMPLEMENTATIONMETHOD: | • Utilize any security or asset that offers superior riskreward, with a preference for liquidity |
| RESULT: | • Outsourced wealth compounding solution for investorswhose primary goal is to grow money over time |
Portfolio Allocations
Below is the target portfolio allocation – the optimal allocation as of the writing of this letter. Investor separate accounts may differ from this allocation due to changes in asset prices, availability to acquire/divest securities in the marketplace, margin & trading capabilities, and tax considerations. Over time, all investor separate accounts converge upon the target portfolio allocation.
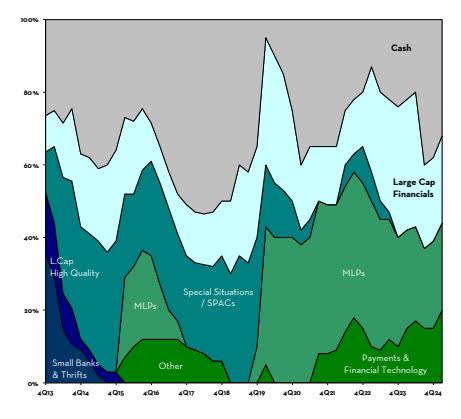
• Large-Cap Financials: 24% NAV
In March 2023, the U.S. banking system experienced a brief crisis when three banks failed in quick succession. The prices of large regional banks fell precipitously as investors indiscriminately sold shares, allowing us to significantly increase our exposure at fire-sale prices. At the time, market sentiment did not distinguish between Held To Maturity (“HTM”) vs. Available For Sale (“AFS”) securities unrealized losses, which presented us with a unique opportunity. While other market participants viewed the AFS unrealized losses as an undesirable risk, we viewed them as a juicy source of future upside as the losses naturally reverse with time. We were correct. These investments have increased significantly in value since then. Taking into account recent price appreciation, we estimate this basket (through the combination of AFS unrealized loss reversals, profitable earnings yields, and valuation multiple expansion) will generate ~2X in the next 3 years. See our 2023 1st Quarter Letter for our Regional Bank investment thesis.
• Energy Infrastructure / Master Limited Partnerships (MLPs): 24% NAV
Energy infrastructure companies with assets indispensable to the smooth function of modern society. These investments were made in early 2020, taking advantage of commodity price volatility, shareholder turnover, forced selling, and uncertainty related to the long-term demand of fossil fuels which drove prices to extremely low levels. Since then, geopolitical strife, inflation, and increased recognition of the limitations of renewable energy have led market participants to reembrace fossil fuels, which in turn has lifted the prices of our MLPs. The size of this allocation peaked at 42% of NAV in late-2021, and has gradually declined due to harvested gains, trimmed exposures, and M&A activity. MLPs remain a cornerstone of our portfolio given favorable industry demand dynamics, stable cash flows, conservative balance sheets, reasonable valuations (at ~10x Cash Flow), and generous cash distributions. See our 2019 4th Quarter and 2021 2nd Quarter Letters for our MLP investment thesis.
• Payments, Financial, and Technology Software: 20% NAV
Fast-growing payments, financial, and technology software businesses with favorable revenue tail winds, operating in areas with vast untapped total addressable markets, generating cash profits, actively reinvesting profits back into the business at high incremental margins, and self-funding future growth with little/no equity dilution. We purchased these investments at attractive prices that will generate at least 3X return in 5 years based on reasonable topline growth & margin assumptions. This allocation will increase in size over time as market volatility presents us with buying opportunities. See our 2022 1st Quarter Letter for more details.
• Cash & Cash Equivalents: 32% NAV
This category will fluctuate depending on investment opportunities available in the marketplace. We collect ~4% interest and dividends per year which continuously replenishes our cash balance.
Target Portfolio Allocation % Over Time

Portfolio Return* Analysis & Future Positioning
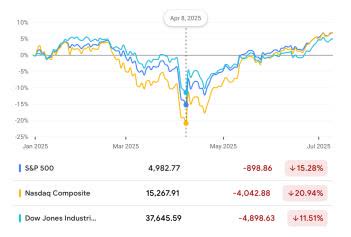
The Portfolio* return +2.3% (NET) in the 2nd quarter, bringing our year-to-date (YTD) return to +2.4%.
Unpredictable trade policy injected fresh uncertainty into the economy, fueling volatility in the second quarter, especially in April. By design, our conservative positioning kept the portfolio resilient, dampening much of the downside. At the depth on April 8th, our portfolio declined -7.8% YTD, compared to the Dow at -11.5%, S&P 500 -15.3%, and NASDAQ -20.9%.
| Image: Seal of the President of the United States. Reciprocal Tariffs | Tariffs Chargedto the U.S.A. | U.S.A. DiscountedReciprocal Tariffs | Image: Seal of the President of the United States. Reciprocal Tariffs | Tariffs Chargedto the U.S.A. | U.S.A. DiscountedReciprocal Tariffs |
|---|---|---|---|---|---|
| China | 67% | 34% | Peru | 10% | 10% |
| European Union | 39% | 20% | Nicaragua | 36% | 18% |
| Vietnam | 90% | 46% | Norway | 30% | 15% |
| Taiwan | 64% | 32% | Costa Rica | 17% | 10% |
| Japan | 46% | 24% | Jordan | 40% | 20% |
| India | 52% | 26% | Dominican Republic | 10% | 10% |
| South Korea | 50% | 25% | United Arab Emirates | 10% | 10% |
| Thailand | 72% | 36% | New Zealand | 20% | 10% |
| Switzerland | 61% | 31% | Argentina | 10% | 10% |
| Indonesia | 64% | 32% | Ecuador | 12% | 10% |
| Malaysia | 47% | 24% | Guatemala | 10% | 10% |
| Cambodia | 97% | 49% | Honduras | 10% | 10% |
| United Kingdom | 19% | 10% | Madagascar | 93% | 47% |
| South Africa | 69% | 34% | Myanmar (Burma) | 88% | 44% |
| Brazil | 10% | 10% | Tunisia | 55% | 28% |
| Bangladesh | 74% | 37% | Kazakhstan | 54% | 27% |
| Singapore | 19% | 10% | Serbia | 74% | 37% |
| Israel | 33% | 17% | Egypt | 10% | 10% |
| Philippines | 34% | 17% | Saudi Arabia | 10% | 10% |
| Chile | 19% | 10% | El Salvador | 10% | 10% |
| Australia | 19% | 10% | Côte d’Ivoire | 41% | 21% |
| Pakistan | 58% | 29% | Laos | 95% | 48% |
| Turkey | 19% | 10% | Botswana | 74% | 37% |
| Sri Lanka | 88% | 44% | Trinidad and Tobago | 12% | 10% |
| Colombia | 19% | 10% | Morocco | 10% | 10% |

We were well-prepared to deploy capital in size. Having compiled an extensive watchlist of preresearched securities across a range of industries, we knew exactly what we wanted to own and at what price. But only two buy price alerts were triggered: FCNCA and PINS, both were added to the portfolio, totaling 2.5% NAV. The selloff was brief and sharp, but because it began from already frothy valuation levels, it wasn’t deep enough to create widespread bargains. We didn’t swing for the fences because the pitch wasn’t fat enough.
Markets have since rebounded as if April had been a passing fever dream. The speed of the reversal and collective willingness to shrug off tariff and supply chain risks signal widespread investor exuberance. Our generalist research lens gives us visibility across many asset classes and sectors, and we observe inflated prices nearly everywhere we look. The exuberance is not localized to one area it’s a landscape of overlapping excess.
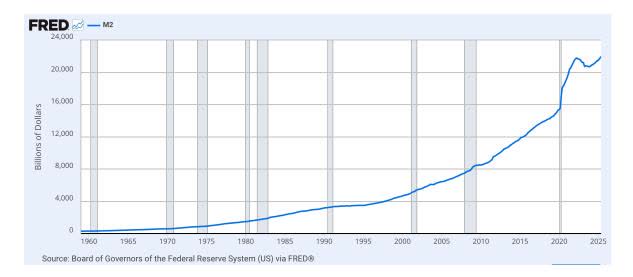
We believe the macroeconomic backdrop is responsible for the exuberance observed in our fundamental research. Since 2020, money supply has surged in a short period of time, driven by pandemic-era stimulus and quantitative easing. This excess liquidity must flow somewhere, and it has: into crypto, NFTs, luxury watches, SPACs, private credit, meme stocks — basically anything that can be purchased. People simply don’t want to sit on idle cash. Exuberance is merely the outward symptom of the underlying ailment: too much money chasing too few assets, driving up prices to irrationally high levels, beyond what fundamentals justify and without concern for actual economic return potential.

This is the opposite of how we invest capital. We wrote a decade ago:
“Future performance returns are a function of purchase price – the higher the purchase price, the lower the likelihood of future expected returns. A bond does not increase coupon payments because investors are hungrier for yield in a low-rate environment. A stock does not generate more profits because people pay higher prices for its shares. The economic return potential of assets do not change simply because market participants become less fearful and are now willing to pay more…and hoping won’t make it so…”
Every dollar we invest — or hold back — is deployed with clear intent: either to earn an adequate return now or to preserve optionality for better opportunities ahead. We know what we own, why we
own it, what we paid, and what we expect to get in return (see allocations section). We continue to expand our realms of expertise through fundamental research, centered on asking ourselves: at what price, if any, would we be willing to own this business or asset? Once that price is reached, we act. If not, we wait. This clarity of discipline keeps us focused and helps us tune out noise, resist social pressure, and remain patient and flexible — ready to pounce when markets once again offer opportunities worth buying.
Our investment philosophy of patient opportunism has remained consistent since inception. Our investment strategy is simple (though not easy to implement): we buy assets when they’re cheap and we hold cash when they’re not. In today’s exuberant market environment, consistency of discipline will continue to guide us, just as it has done so lucratively in the past.
Please do not hesitate to reach out with any questions. As always, thank you for your trust. We look forward to continuing our capital compounding adventures in the years ahead.
Yours very truly,
Vivian Y. Chen, CFA, Portfolio Manager
Marram Investment Management
Appendix: Historical Performance Returns (net of Fees)*
|
* Unaudited, net return figure calculation assumes 2% per annum management fee, pro-rated and deducted monthly from performance of the portfolio manager’s taxable separate account which does not pay management or performance fees. This separate account most accurately reflects the long-term investment strategy of Marram Investment Management. Remaining separate accounts were purposefully omitted as they may deviate from the strategy due to fee structure, custodial & trading expenses, fund transfer & order timing, margin & trading capabilities, tax considerations, and other account restrictions. Returns for each separate account may differ. Please refer to your account statements for actual net return figures. Returns presented for S&P 500 include dividend reinvestment. While the S&P 500 is a well-known and widely recognized index, the index has not been selected to represent an appropriate benchmark for Marram’s investment strategy whose holdings, performance and volatility may differ significantly from the securities that comprise the index. Investors cannot invest directly in an index (although one can invest in an index fund designed to closely track such index). Historical performance is not indicative of future results. An investment is speculative and involves a high degree of risk and possible loss of principal capital. All information presented herein is for informational purposes only. No investor or prospective investor should assume that any such discussion serves as the receipt of personalized advice from Marram. Investors are urged to consult a professional advisor regarding the possible economic, tax, legal or other consequences of entering into any investments or transactions described herein. A list of all recommendations made by Marram within the immediately preceding period of not less than one year is available upon request. It should not be assumed that recommendations made in the future will be profitable or will equal the performance of the securities on this list. Specific companies or securities shown are meant to demonstrate Marram’s investment style and the types of companies, industries, and instruments in which we invest, and are not selected based on past performance. The analyses and conclusions include certain statements, assumptions, estimates and projections that reflect various assumptions by Marram concerning anticipated results that are inherently subject to significant economic, competitive, and other uncertainties and contingencies, and have been included solely for illustrative purposes. No representations, express or implied, are made as to the accuracy or completeness of such statements, assumptions, estimates or projections, or with respect to any other materials herein. |
Original Post
Editor’s Note: The summary bullets for this article were chosen by Seeking Alpha editors.
Read the full article here

")

