
")


Breadth has been the topic of the week, with the market cap weighted S&P 500 pushing to new highs, leaving behind cumulative AD lines and equal-weight measures of the same index.
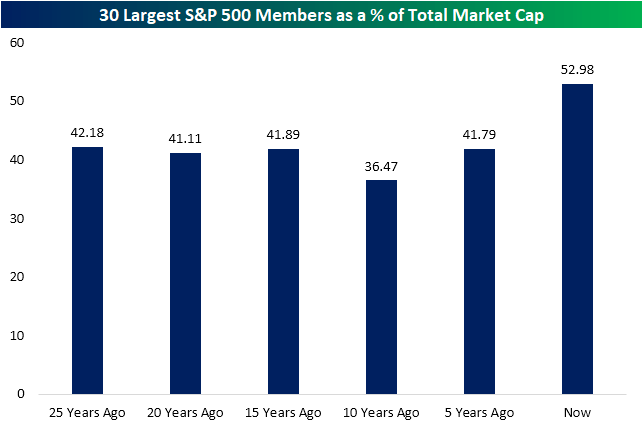
This means the index’s largest stocks are providing an outsized boost to performance, so in the charts below, we take a look at the weighting of those largest stocks over the years. As shown below, the combined market cap of what are currently the 30 largest stocks in the S&P 500 account for almost 53% of the index.
Looking back to the comparable point of the year 5, 10, 15, 20, and 25 years ago, it has been common for the 30 largest stocks to account for around 40% of the S&P 500’s total market cap. However, the current reading is over 10 percentage points higher than even June 1999 when the 30 largest accounted for 42.18%.
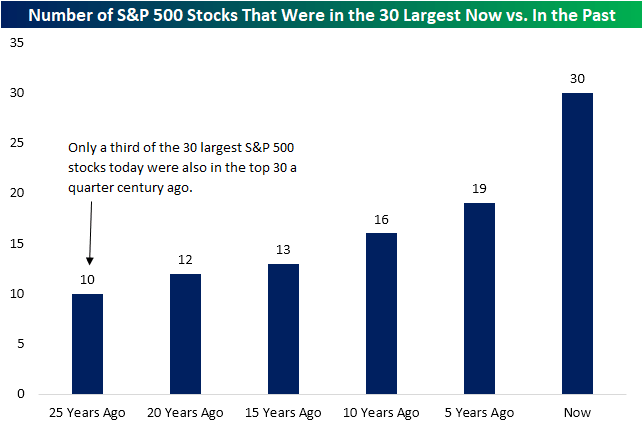
As we have mentioned in the past, even though one stock may be a giant at one point in time, it is not guaranteed to hold its dominance. In the chart below, we show the number of stocks that currently rank as one of the top 30 largest S&P 500 members and also ranked in the top 30 in years past.
As shown, only around half of the current mega-caps were also mega-caps of a decade ago. Setting the calendar back a quarter century, a third of the 30 largest S&P 500 stocks were also in the top 30 in 1999.
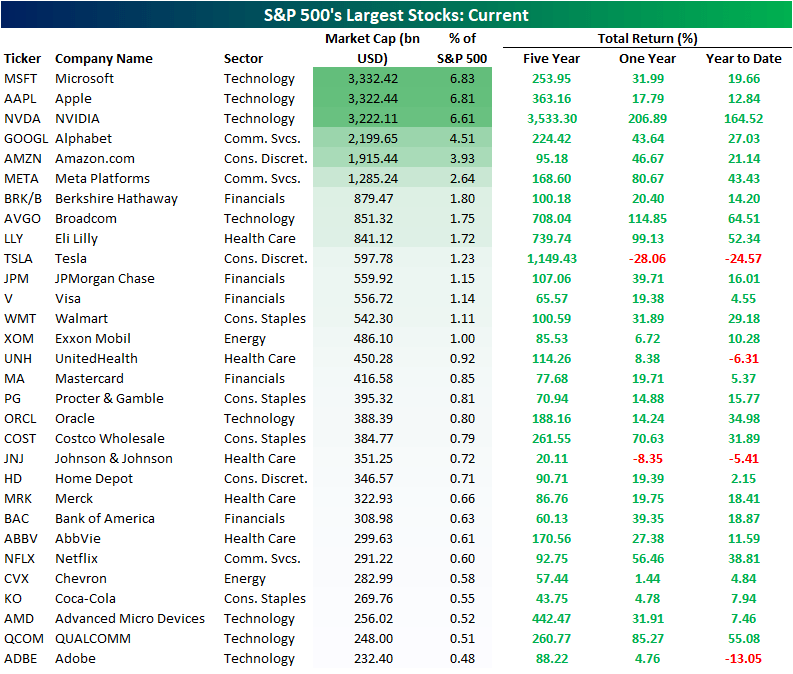
Below we show the 30 S&P 500 members that currently have the largest market caps. Of these, there are only a couple, Tesla (TSLA) and Johnson & Johnson (JNJ), that have provided a negative return in the past year. Granted, TSLA has also been a ten bagger over the past five years. The only other stock that boasts such an outstanding gain is, of course, Nvidia (NVDA).
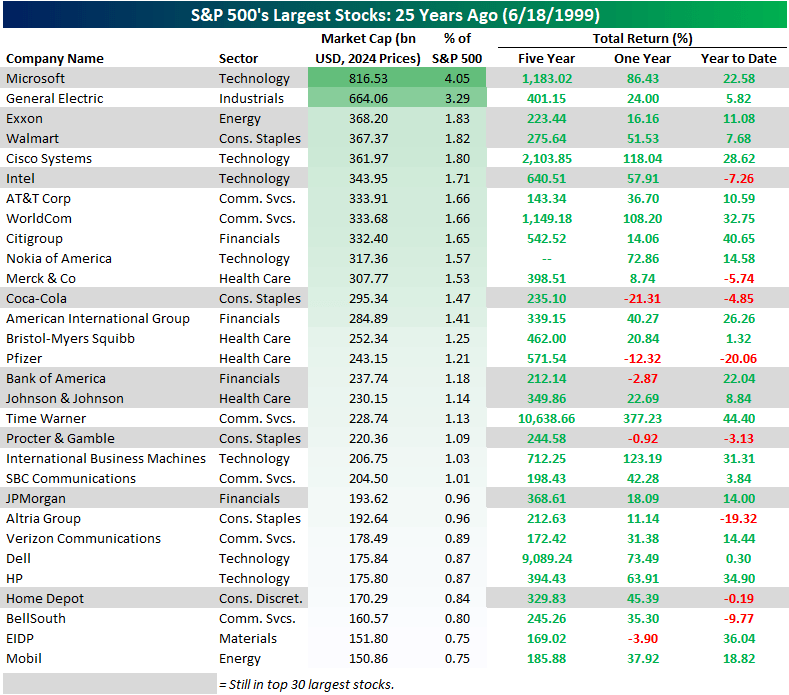
Below is a look at the 30 largest stocks in the S&P 500 as it stood twenty-five years ago in June 1999. As previously mentioned, there are ten stocks in the current top 30 that were in the top 30 in June 1999 (highlighted in grey below).
At the top of the list is the familiar face of Microsoft (MSFT) with an inflation adjusted market cap (in 2024 prices) of $816 bn back then. Like TSLA and NVDA now, MSFT had also been a ten bagger over the previous five years. However, one difference between 1999 and now is that stocks with such large gains had much more company back then.
Whereas currently there are only two of the 30 largest stocks that are up 1,000%+ in the last five years, in 1999 there were five: MSFT, Cisco (CSCO), WorldCom, Time Warner, and Dell (DELL). Again, only one of those is still a mega-cap today while others like WorldCom had more dramatic falls from grace following bankruptcies only a few years later.
In comparing 1999 to today, currently the S&P 500 is in fact more concentrated at the top. Just the top three stocks today – MSFT, AAPL, and NVDIA – account for over 20% of total S&P 500 market cap compared to around 9% for the comparable three – MSFT, GE (GE), and Exxon (XOM) – in 1999.
Original Post
Editor’s Note: The summary bullets for this article were chosen by Seeking Alpha editors.
Read the full article here
")


")
")
")

")